The Loxahatchee River District, through its project RiverKeeper, collects water quality samples throughout the watershed and tests those samples for a variety of analytes to monitor the ecological health of the river, and to determine the location and extent of the water quality issues that require attention.
Here we present the results in a variety of ways starting with a simple monthly overall score that includes all sites and all parameters sampled during the preceding month. The score is computed as the percentage of samples that meet the Florida Department of Environmental Protection’s Water Quality Standards for each sampling site.
Next, we provide a summary of results for the “Big 4” important water quality parameters: Total Nitrogen, Total Phosphorus, Chlorophyll a, and Bacteria. Nitrogen and phosphorus are measures of key nutrients that can lead to impairment, chlorophyll is a measure of impairment and biotic activity that can indicate nutrient enrichment of a system, and bacteria (E. coli and Enterococci) may indicate an increased health risk to recreational water users (please see our weekly bacteria monitoring results page for more information). Further down this page we present additional results in map and tabular format.
For more results, reports and data visualization and exploration tools, please visit the District’s RiverKeeper web page.
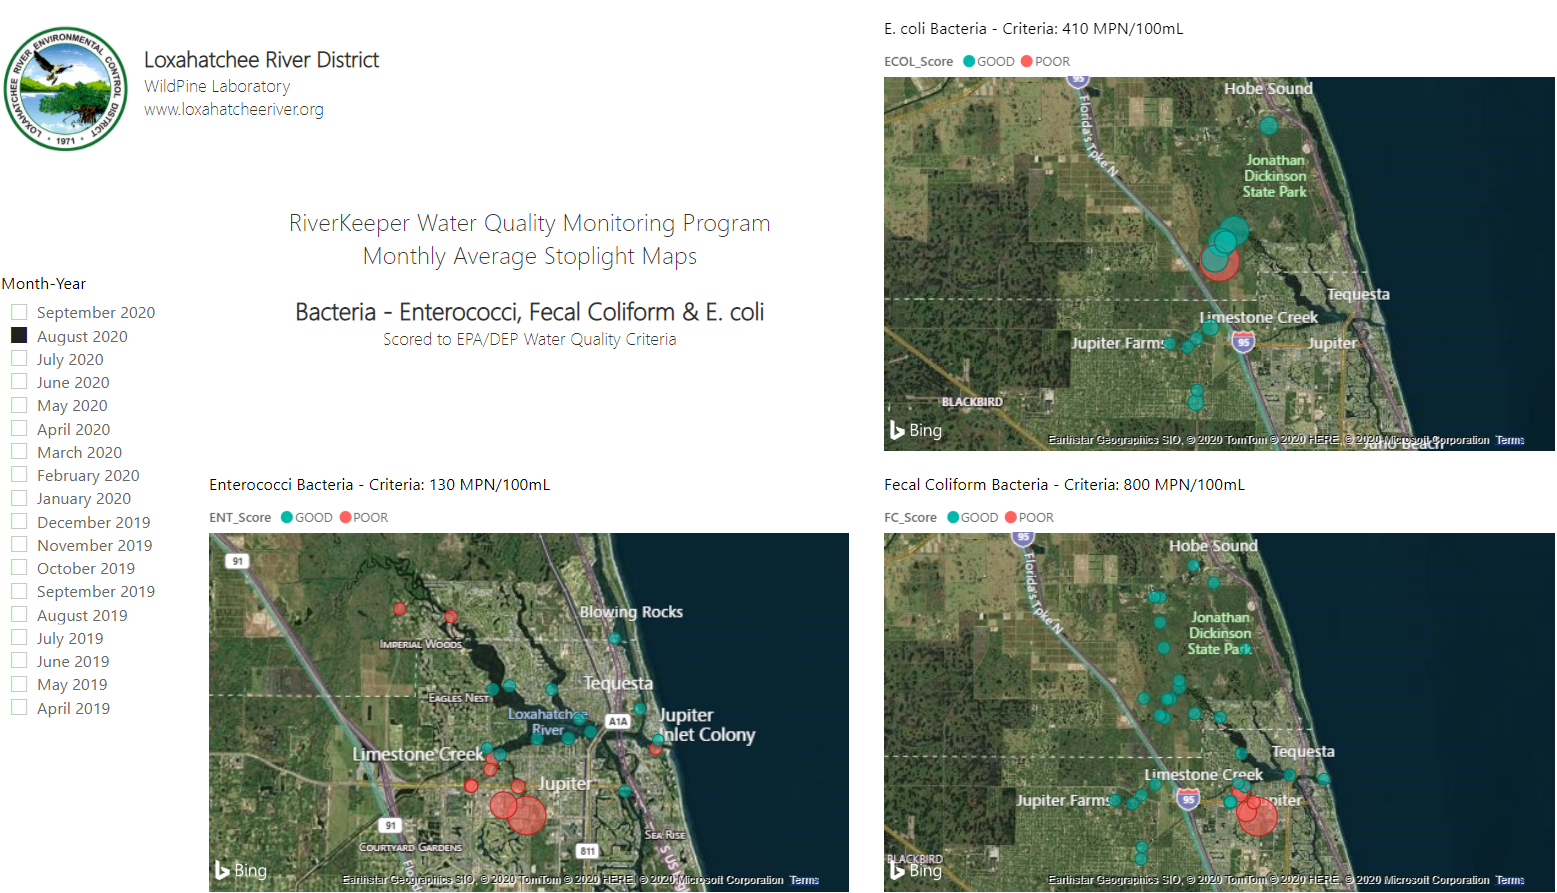
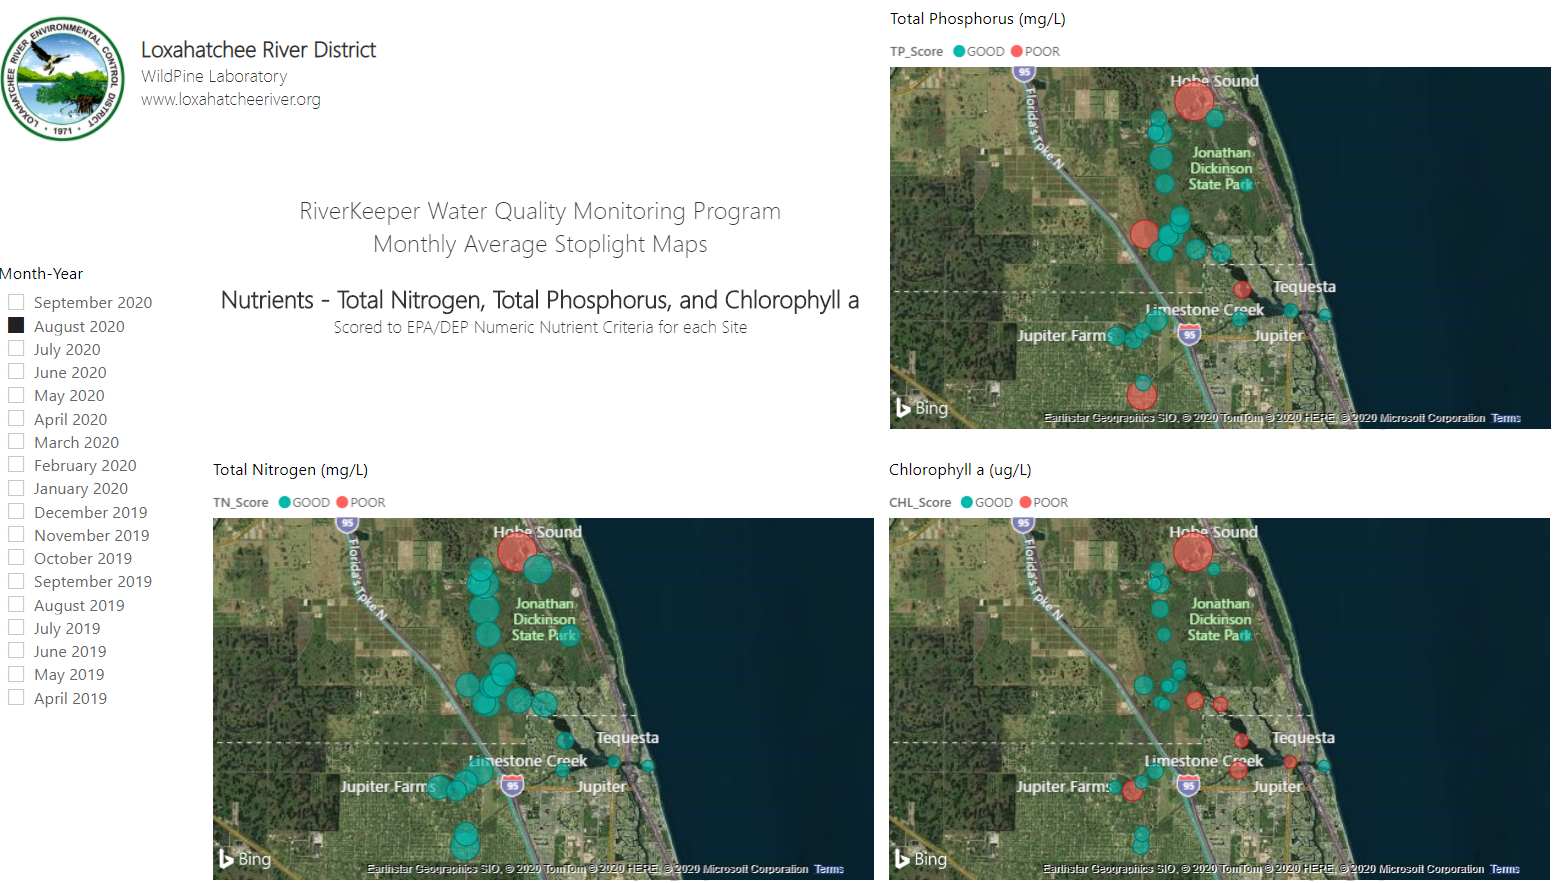
The Monthly Stoplight Maps present the water quality results on interactive maps where the user can select the month of interest and zoom in/out on each map. We provide two sets of maps – Bacteria (below left) and Nutrients (below right) with the results scored “Good” or “Poor” relative to the FDEP water quality standard for each sampling site. The bacteria maps present monthly results for enterococci, E. coli and fecal coliform bacteria. The Nutrients maps present the monthly results for Total Nitrogen, Total Phosphorus and Chlorophyll a.
Monthly “Stoplight” Maps
Monthly Bacteria
Click the map below to open in a new window
Monthly Nutrients
Click the map below to open in a new window
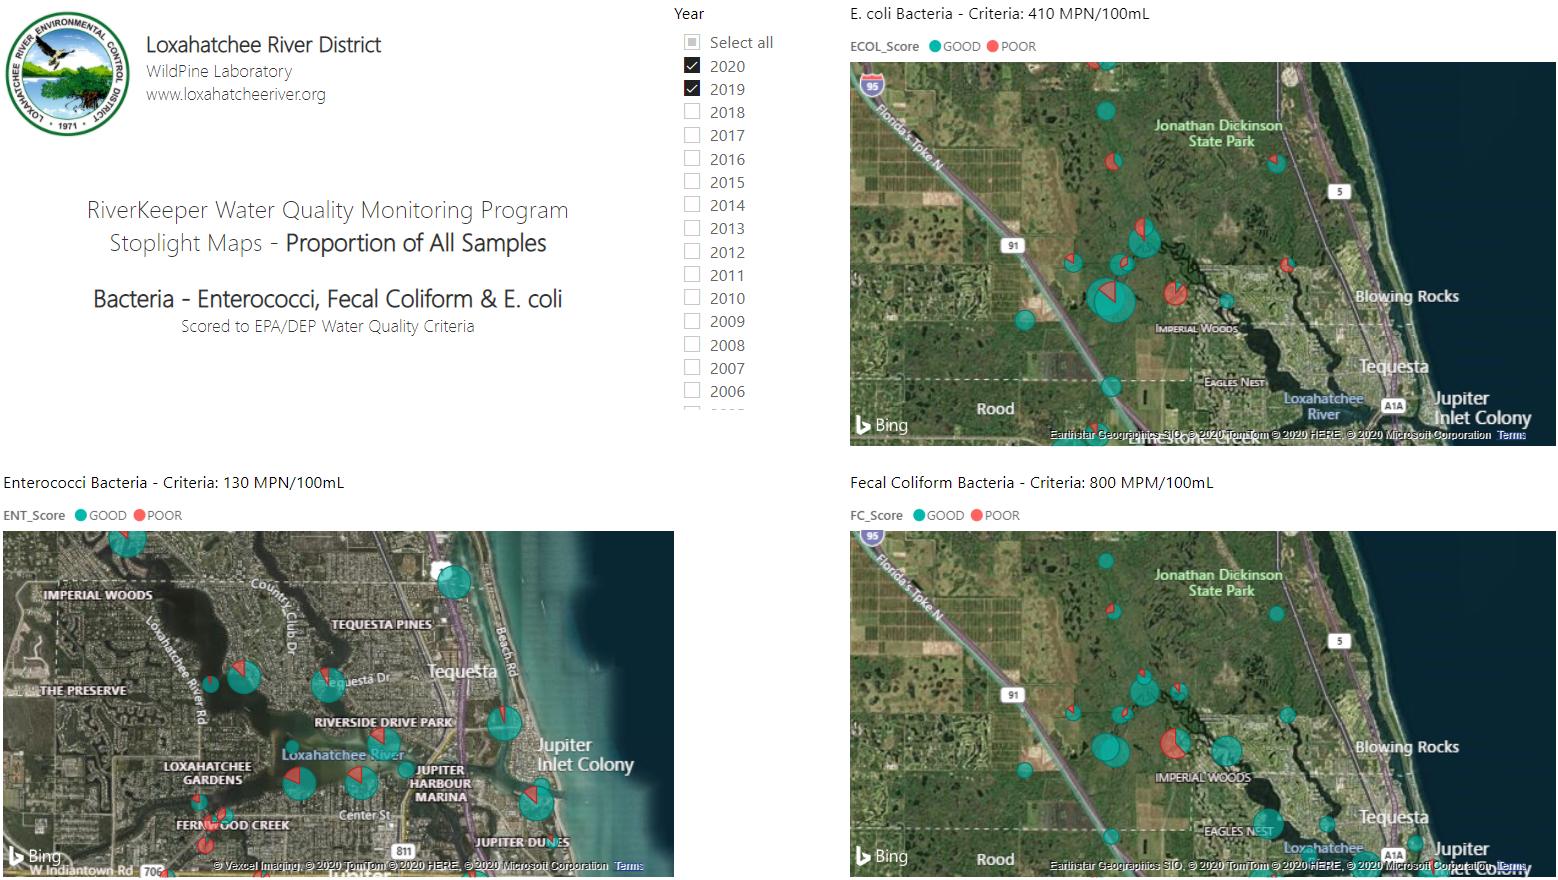
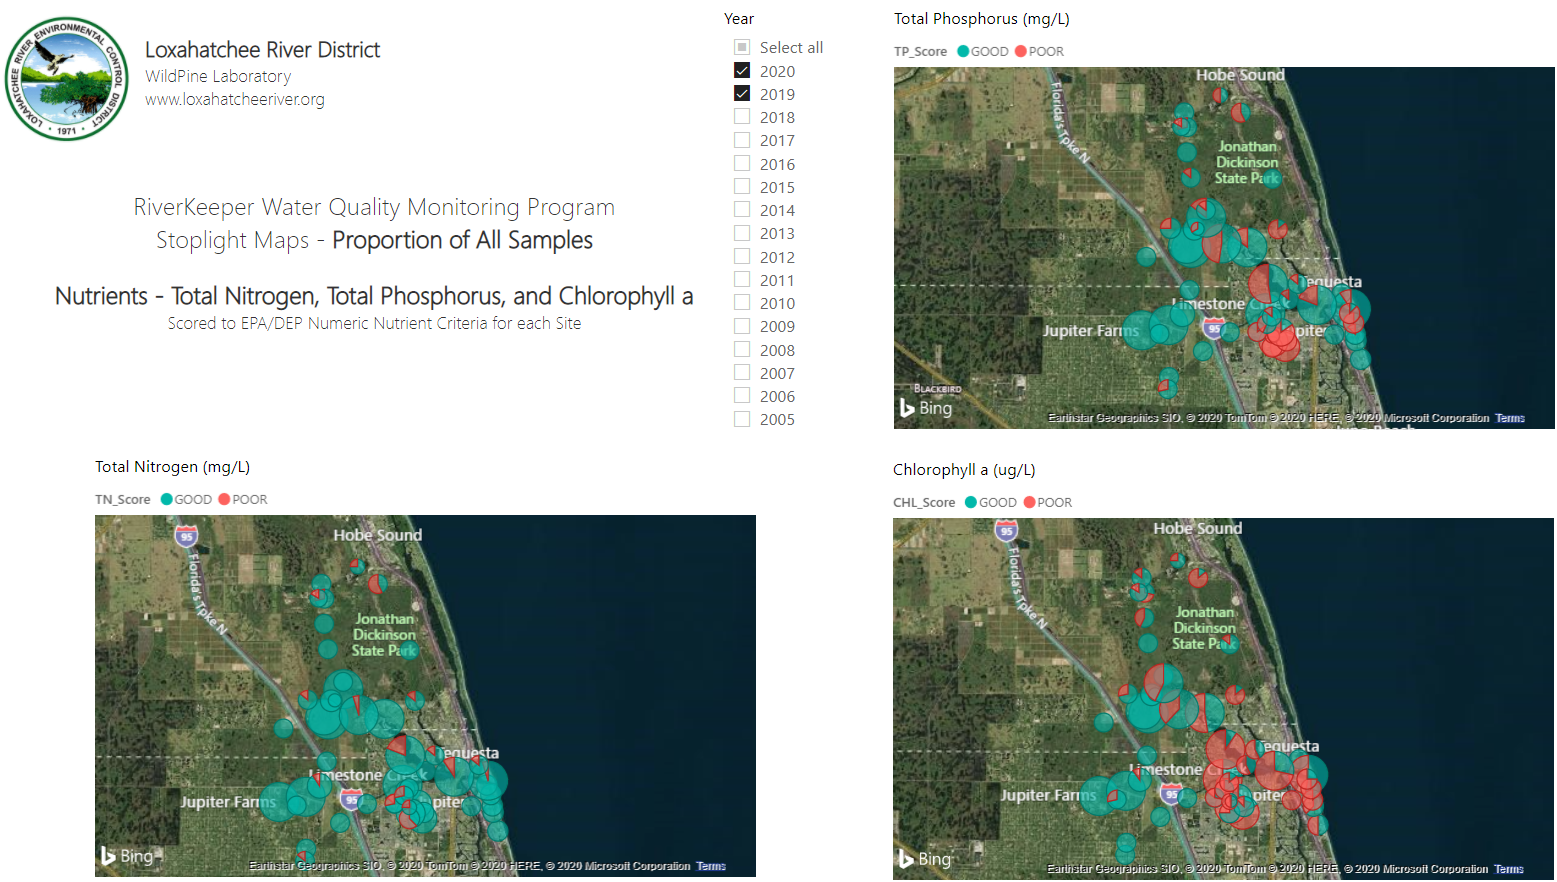
The Annual “Pie Chart” Maps present the water quality results as a proportion of results scoring “Good” and “Poor” relative to the FDEP water quality for each site, for the years selected, as the symbol for each sampling site.
Annual “Pie Chart” Maps
Bacteria Proportion
Click the map below to open in a new window
Nutrients Proportion
Click the map below to open in a new window
The following scorecard presents the overall score, total nitrogen, total phosphorus, chlorophyll, and bacteria results in tabular format for historical context.
The Loxahatchee River District’s WildPine Ecological Laboratory compiles these results. If you have questions about this information, please contact the Loxahatchee River District at (561) 747-5700 or wildpine@lrecd.org.